File:Total US Federal Debt by President (1940 to 2015).png
Original file (916 × 589 pixels, file size: 26 KB, MIME type: image/png)
Summary
| Description |
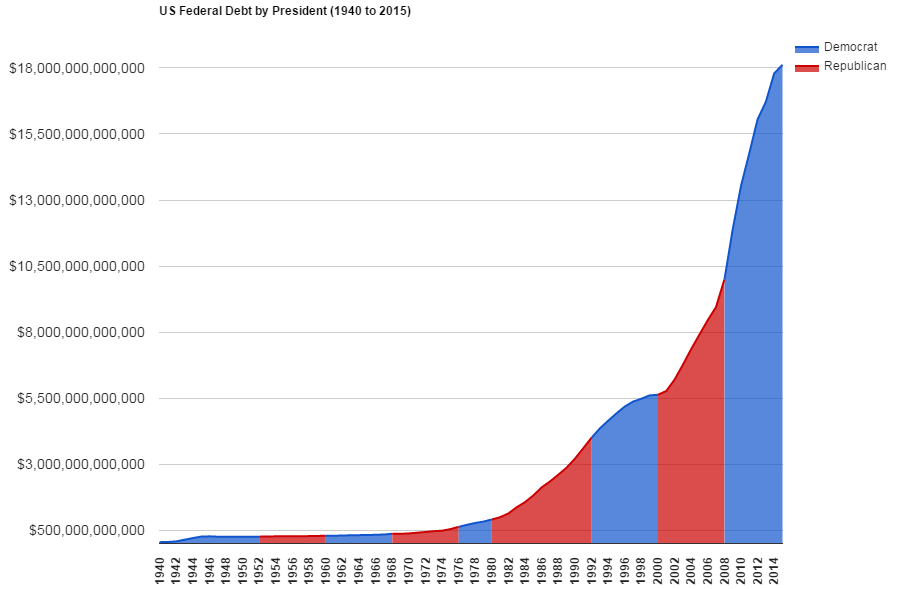
English: A chart, created using Google Spreadsheets, depicting the total U.S. federal debt from 1940 to 2014. Presidential terms of Democratic (blue) and Republican (red) presidents are shown.
|
| Date | |
| Source | Own work |
| Author | SColombo based on style & updated datasource of previous version by Ninjatacoshell. White House recently released final (non-projected) data through 2014 & projections through 2020. |
| Other versions |
|
.png)
.png)
.png)
.png)
Licensing
- You are free:
- to share – to copy, distribute and transmit the work
- to remix – to adapt the work
- Under the following conditions:
- attribution – You must give appropriate credit, provide a link to the license, and indicate if changes were made. You may do so in any reasonable manner, but not in any way that suggests the licensor endorses you or your use.
- share alike – If you remix, transform, or build upon the material, you must distribute your contributions under the same or compatible license as the original.

|
Permission is granted to copy, distribute and/or modify this document under the terms of the GNU Free Documentation License, Version 1.2 or any later version published by the Free Software Foundation; with no Invariant Sections, no Front-Cover Texts, and no Back-Cover Texts. A copy of the license is included in the section entitled GNU Free Documentation License. |
File history
Click on a date/time to view the file as it appeared at that time.
| Date/Time | Thumbnail | Dimensions | User | Comment | |
|---|---|---|---|---|---|
| current | 21:39, 26 February 2016 | | 916 × 589 (26 KB) | SColombo | Removed the whitespace that I'd inadvertently added in the last revision. |
| 21:35, 26 February 2016 |  | 916 × 589 (26 KB) | SColombo | Updated to include the finalized 2015 data. Will try to rename image soon. | |
| 15:26, 12 February 2015 |  | 916 × 589 (24 KB) | SColombo Commons | Updated to include final (non-projected) 2014 numbers which were recently released by the White House. | |
| 23:32, 12 March 2014 |  | 955 × 574 (21 KB) | SColombo Commons | Updated to current data. As of this week, data is now available through 2013 from the White House Office of Management and Budget http://www.whitehouse.gov/omb/budget/Historicals/ so the chart is now updated through 2013. The dataset includes projecte... | |
| 23:32, 12 March 2014 |  | 955 × 574 (21 KB) | SColombo Commons | Updated to current data. As of this week, data is now available through 2013 from the White House Office of Management and Budget http://www.whitehouse.gov/omb/budget/Historicals/ so the chart is now updated through 2013. The dataset includes projecte... | |
| 23:32, 12 March 2014 |  | 955 × 574 (21 KB) | SColombo Commons | Updated to current data. As of this week, data is now available through 2013 from the White House Office of Management and Budget http://www.whitehouse.gov/omb/budget/Historicals/ so the chart is now updated through 2013. The dataset includes projecte... | |
| 23:32, 12 March 2014 |  | 955 × 574 (21 KB) | SColombo Commons | Updated to current data. As of this week, data is now available through 2013 from the White House Office of Management and Budget http://www.whitehouse.gov/omb/budget/Historicals/ so the chart is now updated through 2013. The dataset includes projecte... | |
| 17:22, 5 October 2010 |  | 1,310 × 951 (41 KB) | Ninjatacoshell | {{Information |Description={{en|1=A graph, created using Microsoft Excel, depicting the U.S. federal debt from 1940 to 2009, as a percentage of gross domestic product (GDP). Presidential terms of Democratic (blue) and Republican (red) presidents are shown |
File usage
There are no pages that use this file.
Global file usage
The following other wikis use this file:
- Usage on cs.wikipedia.org
- Usage on de.wikipedia.org
- Usage on es.wikipedia.org
- Usage on fr.wikipedia.org
- Usage on pl.wikipedia.org
- Usage on sv.wikipedia.org
- Usage on vi.wikipedia.org
.png)