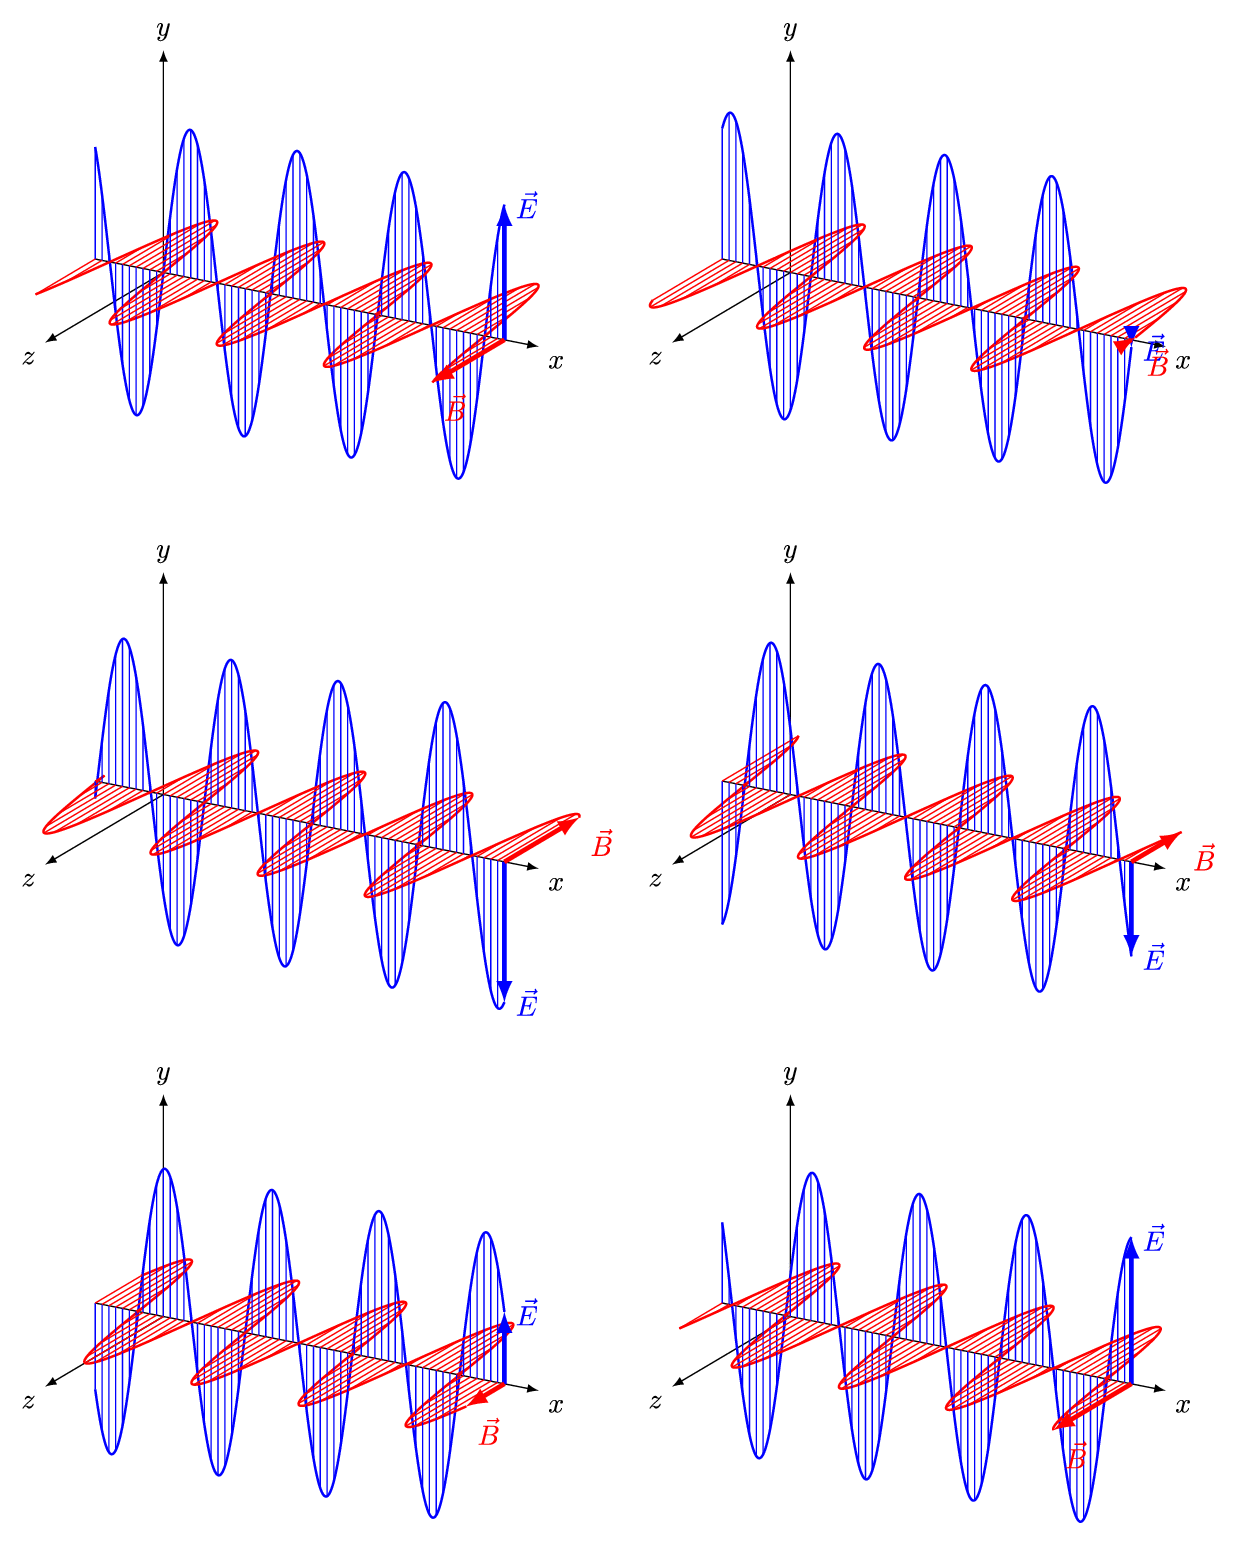
EM-Wave.gif(627 × 522 pixels, file size: 848 KB, MIME type: image/gif, looped, 31 frames, 3.1 s)

This file is from Wikimedia Commons and may be used by other projects. The description on its file description page there is shown below.

Summary

Description
English: plane linearly polarized wave
Deutsch: linear polarisierte elektromagnetische Welle
Date
Source Own work
Author And1mu

Source Code

created with LaTeX and PGF/TikZ

Script to create the animation:

#!/bin/bash

set -eu
DIR="animate"
FILE="EM-Wave"

NUM=0
rm -f ${DIR}/frame???.png
for ANG in $(seq 0 0.05 1.5) ; do
    echo "Creating frame $NUM ..."
    POS=$ANG
    echo $POS $ANG
    sed -i "s/\\\def\\\myt{.\+}/\\\def\\\myt{$POS}/" ${FILE}.tex
    pdflatex -shell-escape ${FILE}.tex 1> /dev/null
    echo "Convert to png ..."
    NUMSTR=$(printf "%03d" $NUM)
    convert -density 200 ${FILE}.svg -shave 3 ${DIR}/frame${NUMSTR}.png
    NUM=$(($NUM+1))
done
cd $DIR
convert -delay 10 -loop 10000 frame*.png  ${FILE}.gif
cd -

The code to create a single frame (EM-Wave.tex):

\documentclass[crop,border=15,tikz,convert={outext=.svg,command=\unexpanded{pdf2svg
    \infile\space\outfile}},multi=false]{standalone}
\usepackage{tikz-3dplot}

\def\myt{0.5}
\def\mypi{3.141592653589793}

\tdplotsetmaincoords{70}{120}
\begin{document}
\begin{tikzpicture}[>=latex,scale=1,tdplot_main_coords]
  \fill[white] (-4,-4.75,-5.5) rectangle (-4,4.5,3.25);
  \draw[->] (0,0,0) -- (3,0,0) node[anchor=north east]{$z$};
  \draw[->] (0,-1,0) -- (0,5.5,0) node[anchor=north west]{$x$};
  \draw[->] (0,0,0) -- (0,0,3) node[anchor=south]{$y$};

  \tdplotsetrotatedcoords{0}{90}{90}
  \draw[thick,blue,smooth,domain=-1:5,samples=200,tdplot_rotated_coords] plot
  function {2*sin(4*(x-\myt))};

  \tdplotsetrotatedcoords{0}{0}{90}
  \draw[thick,red,smooth,domain=-1:5,samples=200,tdplot_rotated_coords] plot
  function {-2*sin(4*(x-\myt))};

  %\tdplotsetrotatedcoords{0}{0}{0}
  \foreach \a in {-1,-0.9,...,5}{
    \def\E{{2*sin(4*180/\mypi*(\a-\myt))}}
    \draw[blue] (0,\a,0) -- (0,\a,\E);
    \draw[red] (0,\a,0) -- (\E,\a,0);
  }
  \draw[ultra thick,blue,->,tips=proper] (0,5,0) --
  (0,5,{2*sin(4*180/\mypi*(5-\myt))}) node[anchor=west]{$\vec{E}$};
  \draw[ultra thick,red,->,tips=proper] (0,5,0) --
  ({2*sin(4*180/\mypi*(5-\myt))},5,0) node[anchor=north west]{$\vec{B}$};
\end{tikzpicture}
\end{document}

Licensing

I, the copyright holder of this work, hereby publish it under the following license:
w:en:Creative Commons
attribution share alike
This file is licensed under the Creative Commons Attribution-Share Alike 4.0 International license.
You are free:
  • to share – to copy, distribute and transmit the work
  • to remix – to adapt the work
Under the following conditions:
  • attribution – You must give appropriate credit, provide a link to the license, and indicate if changes were made. You may do so in any reasonable manner, but not in any way that suggests the licensor endorses you or your use.
  • share alike – If you remix, transform, or build upon the material, you must distribute your contributions under the same or compatible license as the original.

Captions

plane linearly polarized wave

Items portrayed in this file

depicts

27 June 2016

File history

Click on a date/time to view the file as it appeared at that time.

Date/TimeThumbnailDimensionsUserComment
current18:31, 14 May 2021Thumbnail for version as of 18:31, 14 May 2021627 × 522 (848 KB)SchwunkelReverted to version as of 18:31, 1 June 2017 (UTC)
18:17, 14 May 2021Thumbnail for version as of 18:17, 14 May 2021631 × 523 (1.88 MB)Schwunkelpi/2 phase added -> E=sin() B=cos()
18:31, 1 June 2017Thumbnail for version as of 18:31, 1 June 2017627 × 522 (848 KB)Debenbenchanged axis labels
20:13, 27 June 2016Thumbnail for version as of 20:13, 27 June 2016627 × 522 (779 KB)And1mufix pointing vector directions switch E/B axis direction
19:45, 27 June 2016Thumbnail for version as of 19:45, 27 June 2016627 × 522 (780 KB)And1muUser created page with UploadWizard

The following page uses this file:

Global file usage